Use the following information to answer the question. Suppose the manager of a large furniture store wants to estimate the amount spent by customers during the holiday season. She took a random sample of customers and recorded the amount they spent. A histogram of the data shows that the data is strongly left- skewed. The figures below show the confidence intervals for the mean amount spent using (A) raw (untransformed) data, and (B) log- transformed data, which showed a more normally distributed data set. Use this information to answer the question.
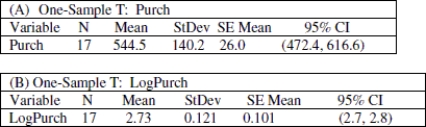
-Calculate the width of both intervals (note that you will need to convert the log- transformed interval back into dollars) . Which interval is narrower?
A) Width of interval for untransformed data: 144.2; width of interval for transformed data: 129.8. The width of the interval for the log transformed data is narrower.
B) Width of interval for untransformed data: 72.1; width of interval for transformed data: 273. The width of the interval for the log transformed data is narrower.
C) Width of interval for untransformed data: 144.2; width of interval for transformed data: 152.5. The width of the interval for the untransformed data is narrower.
D) Cannot be determined with the given information
Correct Answer:
Verified
Q2: State the null and alternative hypothesis and
Q3: Choose the statement that is not true
Q4: Use the following information to answer the
Q5: Choose the correct null and alternative hypothesis
Q6: A used car lot owner wanted to
Q7: Which of the following QQ plots most
Q8: Use the following information to answer the
Q9: Use the following information to answer the
Q10: Which of the following is an indication
Q11: Find the mean, median, and geometric mean
Unlock this Answer For Free Now!
View this answer and more for free by performing one of the following actions

Scan the QR code to install the App and get 2 free unlocks

Unlock quizzes for free by uploading documents