Multiple Choice
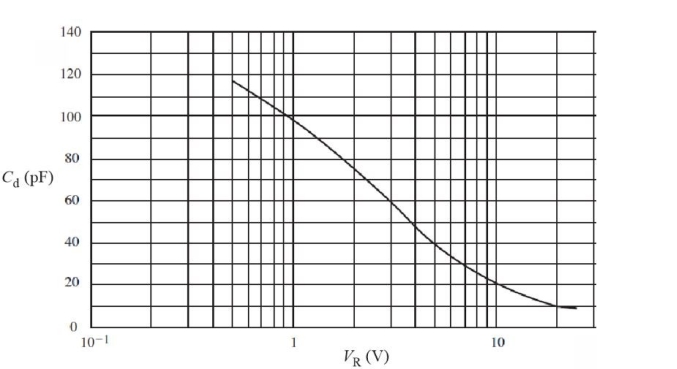 Figure 3 Bias curve for a typical varactor diode
-Refer to Fig 3. For the varactor diode shown, the CR between 0.5 V and 10 V is approximately
A) 18
B) 11
C) 5.9
D) 1.5
Correct Answer:
Verified
Related Questions
Q30: Photodiodes and varactor diodes are normally operated
Q31: A diode with a negative resistance characteristic
Q32: In a silicon solar cell, sunlight
A)creates electron-
Q33: A zener diode is also called a
Unlock this Answer For Free Now!
View this answer and more for free by performing one of the following actions

Scan the QR code to install the App and get 2 free unlocks

Unlock quizzes for free by uploading documents