Use the following to answer questions
This graph depicts fictional data that replicate the pattern of performance observed in a study published by Nietfeld and Ender (2003) .
Figure: Intelligence and Teaching Efficacy 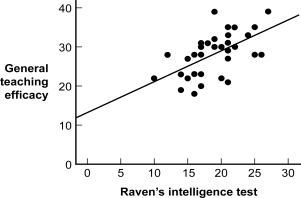
-(Figure: Intelligence and Teaching Efficacy) What might be one way of improving the readability of the graph?
A) Add some ducks to the graph.
B) Trim the range represented on both axes so that it depicts only values in the actual data set.
C) Use a computer program to put gridlines on the background of the graph.
D) Expand the range represented on both axes so that it depicts values beyond the actual data set for grounding.
Correct Answer:
Verified
Q1: At major research institutions, the intense pressure
Q3: Use the following to answer questions
This
Q4: Use the following to answer questions
Figure:
Q5: To efficiently conduct an alumni survey, a
Q6: Use the following to answer questions
This
Q7: A researcher labels the dependent variable of
Q8: Use the following to answer questions
Figure:
Q9: Use the following to answer questions
This
Q10: The interpolation lie can involve:
A) using a
Q11: Use the following to answer questions
This
Unlock this Answer For Free Now!
View this answer and more for free by performing one of the following actions

Scan the QR code to install the App and get 2 free unlocks

Unlock quizzes for free by uploading documents