Use the following to answer questions
This graph depicts fictional data that replicate the pattern of performance observed in a study published by Nietfeld and Ender (2003) .
Figure: Intelligence and Teaching Efficacy 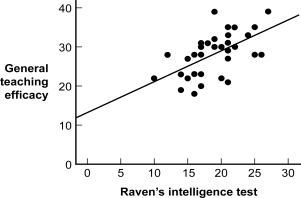
-(Figure: Intelligence and Teaching Efficacy) The type of graph depicted in the figure is a:
A) nonlinear relation plot.
B) Pareto chart modified to dot form.
C) scatterplot with a line of best fit.
D) histogram.
Correct Answer:
Verified
Q1: At major research institutions, the intense pressure
Q2: Use the following to answer questions
This
Q3: Use the following to answer questions
This
Q4: Use the following to answer questions
Figure:
Q5: To efficiently conduct an alumni survey, a
Q7: A researcher labels the dependent variable of
Q8: Use the following to answer questions
Figure:
Q9: Use the following to answer questions
This
Q10: The interpolation lie can involve:
A) using a
Q11: Use the following to answer questions
This
Unlock this Answer For Free Now!
View this answer and more for free by performing one of the following actions

Scan the QR code to install the App and get 2 free unlocks

Unlock quizzes for free by uploading documents