Use the following to answer questions
This table and figure depict the average SAT scores for entering freshmen in the year 1995 at 36 North Carolina colleges.
Figure: Histogram of SAT 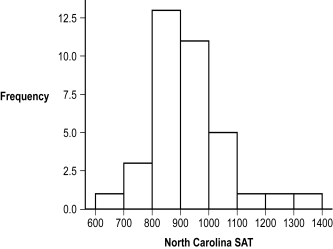
-(Figure: Histogram of SAT) Based on the frequency distribution, approximately how many participants scored 1000 or above?
A) 3
B) 5
C) 8
D) 11
Correct Answer:
Verified
Q1: Which of these is NOT displayed in
Q2: A grouped frequency table is most useful
Q3: Imagine that 18 out of every 33
Q5: Bar graphs typically provide scores for _
Q6: Use the following to answer questions
This
Q7: When constructing a frequency table, the final
Q8: Imagine that 180 people out of a
Q9: A _ is a visual depiction of
Q10: Use the following to answer questions
This
Q11: A _ visually depicts data based on
Unlock this Answer For Free Now!
View this answer and more for free by performing one of the following actions

Scan the QR code to install the App and get 2 free unlocks

Unlock quizzes for free by uploading documents