Use the following to answer questions
This table and figure depict the average SAT scores for entering freshmen in the year 1995 at 36 North Carolina colleges.
Figure: Histogram of SAT 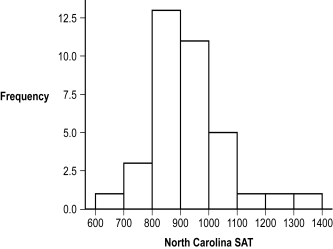
-(Figure: Histogram of SAT) Based on the frequency distribution, what was the interval with the most common score?
A) 700-799
B) 800-899
C) 900-999
D) 1000-1099
Correct Answer:
Verified
Q21: _ distributions are those in which one
Q22: A normal distribution is also known as
Q23: In a _, the tail of the
Q24: Use the following to answer questions
This
Q25: In a _, the tail of the
Q27: In a frequency polygon, the y-axis represents
Q28: Use the following to answer questions
This
Q29: A bell-shaped curve is similar to all
Q30: In a frequency polygon, the x-axis represents
Q31: Use the following to answer questions
This
Unlock this Answer For Free Now!
View this answer and more for free by performing one of the following actions

Scan the QR code to install the App and get 2 free unlocks

Unlock quizzes for free by uploading documents