Use the following to answer questions
This polygon represents a fictional distribution of scores.
Figure: Frequency Polygon 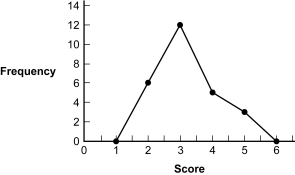
-(Figure: Frequency Polygon) Based on the frequency distribution, how many participants scored between 1 and 3?
A) 2
B) 3
C) 3.5
D) 18
Correct Answer:
Verified
Q26: Use the following to answer questions
Q27: In a frequency polygon, the y-axis represents
Q28: Use the following to answer questions
This
Q29: A bell-shaped curve is similar to all
Q30: In a frequency polygon, the x-axis represents
Q32: Katrina observes and records the number of
Q33: Use the following to answer questions
This
Q34: A positive skew may have a tail
Q35: Use the following to answer questions
Q36: A frequency polygon is similar to a
Unlock this Answer For Free Now!
View this answer and more for free by performing one of the following actions

Scan the QR code to install the App and get 2 free unlocks

Unlock quizzes for free by uploading documents