Use the following graph and information to answer the question.
Flycatcher birds that migrate from Africa to Europe feed their chicks a diet that is almost exclusively moth caterpillars. The graph shows the peak dates of flycatcher arrival in Europe, bird hatching, and peak caterpillar season for the years 1980 and 2000. The y-axis is a measure of the abundance of birds, hatching chicks, and caterpillars.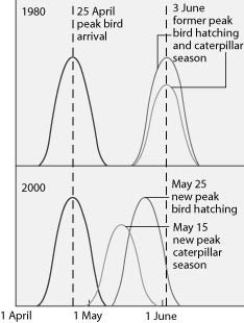
The shift in the peak of caterpillar season is most likely due to ________.
A) earlier migration returns of flycatchers
B) an innate change in the biological clock of the caterpillars
C) global warming
D) acid precipitation in Europe
Correct Answer:
Verified
Q2: A parasitic fungus, Geomyces destructans, has decimated
Q54: Why are changes in the global carbon
Q55: The main cause of the increase in
Q57: The main goal of sustainable development is
Q58: What is a critical load?
A) the amount
Q60: Use the following figure to answer the
Q63: Which of the following is a consequence
Q66: What is the single greatest threat to
Q68: Which of the following statements about protected
Q75: Elevated carbon dioxide levels have been shown
Unlock this Answer For Free Now!
View this answer and more for free by performing one of the following actions

Scan the QR code to install the App and get 2 free unlocks

Unlock quizzes for free by uploading documents