Use the following figure to answer the question.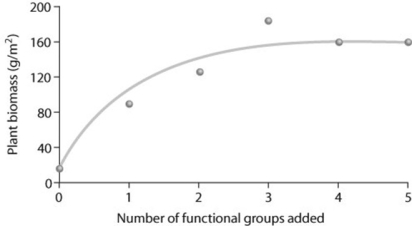
Examine the figure and consider this hypothesis: Plant biomass increases with species richness. Functional groups are categories of plants each containing numerous species, such as grasses and wildflowers, or trees and shrubs. In looking at the data in the figure, how would you relate it to this hypothesis? The hypothesis is ________.
A) partially supported
B) supported
C) rejected
D) neither rejected nor supported
Correct Answer:
Verified
Q2: A parasitic fungus, Geomyces destructans, has decimated
Q55: The main cause of the increase in
Q57: The main goal of sustainable development is
Q58: What is a critical load?
A) the amount
Q59: Use the following graph and information to
Q63: Which of the following is a consequence
Q63: Which of the following strategies would most
Q66: What is the single greatest threat to
Q68: Which of the following statements about protected
Q75: Elevated carbon dioxide levels have been shown
Unlock this Answer For Free Now!
View this answer and more for free by performing one of the following actions

Scan the QR code to install the App and get 2 free unlocks

Unlock quizzes for free by uploading documents