TABLE 2- 3
Every spring semester, the School of Business coordinates a luncheon with local business leaders for graduating seniors, their families, and their friends. Corporate sponsorship pays for the lunches of each of the seniors, but students have to purchase tickets to cover the cost of lunches served to guests they bring with them. The following histogram represents the attendance at the senior luncheon, where X is the number of guests each student invited to the luncheon and f is the number of students in each category.
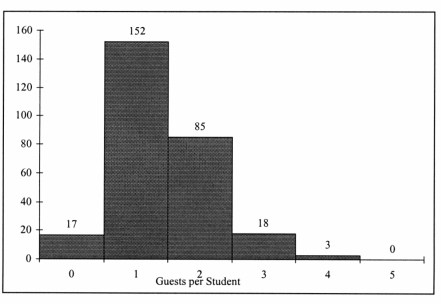
-Referring to the histogram from Table 2- 3, how many graduating seniors attended the luncheon?
A) 388
B) 4
C) 275
D) 152
Correct Answer:
Verified
Q30: The width of each bar in a
Q31: TABLE 2- 5
The following are the
Q32:
Q33: TABLE 2- 5
The following are the
Q34: TABLE 2- 5
The following are the
Q36: When polygons or histograms are constructed, which
Q37: You have collected data on the responses
Q38: You have collected information on the market
Q39: TABLE 2-6
A sample of 200 students
Q40:
Unlock this Answer For Free Now!
View this answer and more for free by performing one of the following actions

Scan the QR code to install the App and get 2 free unlocks

Unlock quizzes for free by uploading documents