The figure below is the ogive for the amount of fat (in grams) for a sample of 36 pizzas products where the upper boundaries of the intervals are: 5, 10, 15, 20, 25, and 30.
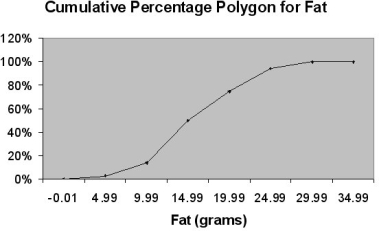
-Referring to Table 2-15, roughly what percentage of pizza products contains less than 10 grams of fat?
A) 75%
B) 50%
C) 14%
D) 3%
Correct Answer:
Verified
Q27: TABLE 2-6
A sample of 200 students
Q28: Data on 1,500 students' height were collected
Q29: A survey of 150 executives were asked
Q30: The width of each bar in a
Q31: TABLE 2- 5
The following are the
Q33: TABLE 2- 5
The following are the
Q34: TABLE 2- 5
The following are the
Q35: TABLE 2- 3
Every spring semester, the School
Q36: When polygons or histograms are constructed, which
Q37: You have collected data on the responses
Unlock this Answer For Free Now!
View this answer and more for free by performing one of the following actions

Scan the QR code to install the App and get 2 free unlocks

Unlock quizzes for free by uploading documents