An Internet-based retail company that specializes in audio and visual equipment is interested in creating a model to determine the amount of money, in dollars, its customers will spend purchasing products from them in the coming year. In order to create a reliable model, this company has tracked a number of variables on its customers. Below you will find the Excel output related to several of these variables. This company has tried using the customer's annual salary for entire household  , the number of children in the household
  , and if the customer purchased merchandise from them in the previous year (
  in 2015).
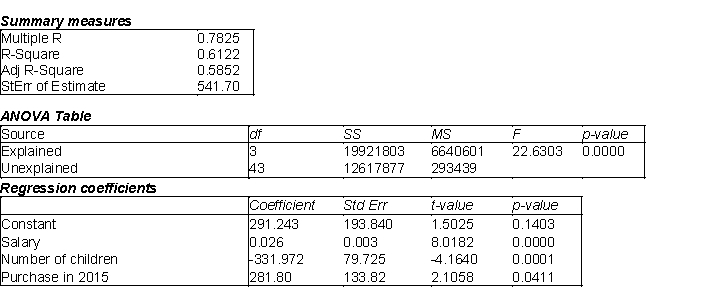
-(A) Estimate the regression model. How well does this model fit the data?
(B) Is there a linear relationship between the explanatory variables and the dependent variable? Explain how you arrived at your answer at the 5% significance level.
(C) Use the estimated regression model to predict the amount of money a customer will spend if their annual salary is $45,000, they have 1 child and they were a customer that purchased merchandise in the previous year (2015).
(D) Find a 95% prediction interval for the point prediction calculated in (C). Use a t-multiple = 2.02.
(E) Find a 95% confidence interval for the amount of money spent by all customers sharing the characteristics described in (C). Use a t-multiple = 2.02.
(F) How do you explain the differences between the widths of the intervals in (D) and (E)?
Correct Answer:
Verified
(A)
View Answer
Unlock this answer now
Get Access to more Verified Answers free of charge
Q25: One method of dealing with heteroscedasticity is
Q28: In order to estimate with 90% confidence
Q64: Below you will find a scatterplot of
Q65: The owner of a pizza restaurant chain
Q66: A new online auction site specializes in
Q67: The information below represents the relationship between
Q70: The owner of a large chain of
Q71: A company that makes baseball caps would
Q73: The manager of a commuter rail transportation
Q74: Do you see any problems evident in
Unlock this Answer For Free Now!
View this answer and more for free by performing one of the following actions

Scan the QR code to install the App and get 2 free unlocks

Unlock quizzes for free by uploading documents