A company that makes baseball caps would like to predict the sales of its main product, standard little league caps. The company has gathered data on monthly sales of caps at all of its retail stores, along with information related to the average retail price, which varies by location. Below you will find regression output comparing these two variables. 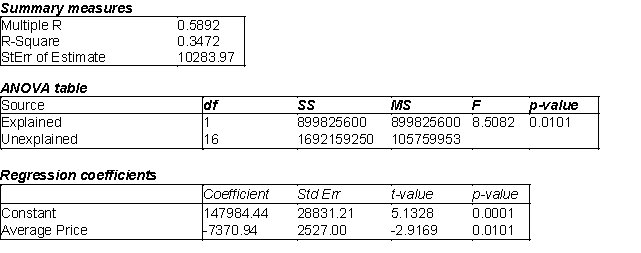
-(A) Estimate the regression model. How well does this model fit the given data?
(B) Is there a linear relationship between X and Y at the 5% significance level? Explain how you arrived at your answer.
(C) Use the estimated regression model to predict the number of caps that will be sold during the next month if the average selling price is $10.
(D) Find a 95% prediction interval for the number of caps determined in (C). Use t- multiple = 2.
(E) Find a 95% confidence interval for the average number of caps sold given an average selling price of $10. Use a t-multiple = 2.
(F) How do you explain the differences between the widths of the intervals in (D) and (E)?
Correct Answer:
Verified
(A)
View Answer
Unlock this answer now
Get Access to more Verified Answers free of charge
Q25: One method of dealing with heteroscedasticity is
Q28: In order to estimate with 90% confidence
Q40: One of the potential characteristics of an
Q66: A new online auction site specializes in
Q67: The information below represents the relationship between
Q69: An Internet-based retail company that specializes in
Q70: The owner of a large chain of
Q73: The manager of a commuter rail transportation
Q74: Do you see any problems evident in
Q75: A manufacturing firm wants to determine whether
Unlock this Answer For Free Now!
View this answer and more for free by performing one of the following actions

Scan the QR code to install the App and get 2 free unlocks

Unlock quizzes for free by uploading documents