Actual sales for January through April are shown below. 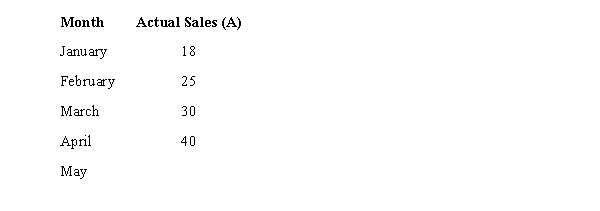 Use exponential smoothing with
  = 0.3 to calculate smoothed values and forecast sales for May from the above data. Assume the forecast for the initial period (January) is 18. Show all of your computations from February through May.
Correct Answer:
Verified
Q37: One measure of the accuracy of a
Q38: What is the forecast for July based
Q39: Exhibit 18-3
Consider the following time series.
Q40: Exhibit 18-2
Consider the following time series.
Q41: For the following time series data, using
Q43: The following time series shows the
Q44: The quarterly sales of a company (in
Q45: Student enrollment at a university over the
Q46: The quarterly sales of a company (in
Q47: The sales records of a major auto
Unlock this Answer For Free Now!
View this answer and more for free by performing one of the following actions

Scan the QR code to install the App and get 2 free unlocks

Unlock quizzes for free by uploading documents