The quarterly sales of a company (in millions of dollars) over the past three years are given in the following table. 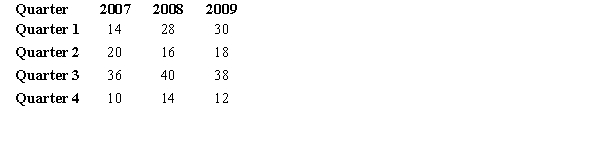
a.Compute the four seasonal factors (Seasonal Indexes). Show all of your computations.
b.The trend for these data is Trend = 20.82 + 0.336 t (t represents time, where t=1 for Quarter 1 of 2007 and t=12 for Quarter 4 of 2009). Forecast sales for the first quarter of 2010 using the trend only. Show all of your computations.
c.Forecast sales for the first quarter of 2010 using the trend and seasonal indexes and write your answer below. Show all of your computations.
Correct Answer:
Verified
View Answer
Unlock this answer now
Get Access to more Verified Answers free of charge
Q41: For the following time series data, using
Q42: Actual sales for January through April are
Q43: The following time series shows the
Q44: The quarterly sales of a company (in
Q45: Student enrollment at a university over the
Q47: The sales records of a major auto
Q48: The following information has been collected on
Q49: What is the forecast for July based
Q50: The following time series shows the
Q51: The following data show the quarterly sales
Unlock this Answer For Free Now!
View this answer and more for free by performing one of the following actions

Scan the QR code to install the App and get 2 free unlocks

Unlock quizzes for free by uploading documents