Exhibit 16-1
In a regression analysis involving 25 observations, the following estimated regression equation was developed. 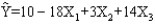 Also, the following standard errors and the sum of squares were obtained.
Sb1 = 3
Sb2 = 6
Sb3 = 7
SST = 4,800
SSE = 1,296
-Refer to Exhibit 16-1. The p-value for testing the significance of the regression model is
A) less than 0.01
B) between 0.01 and 0.025
C) between 0.025 and 0.05
D) between 0.05 and 0.1
Correct Answer:
Verified
Q22: Exhibit 16-1
In a regression analysis involving 25
Q23: Exhibit 16-3
Below you are given a partial
Q24: Exhibit 16-2
In a regression model involving 30
Q25: Exhibit 16-4
In a laboratory experiment, data were
Q26: Exhibit 16-1
In a regression analysis involving 25
Q28: Exhibit 16-2
In a regression model involving 30
Q29: Exhibit 16-2
In a regression model involving 30
Q30: Exhibit 16-4
In a laboratory experiment, data were
Q31: Exhibit 16-3
Below you are given a partial
Q32: Exhibit 16-4
In a laboratory experiment, data were
Unlock this Answer For Free Now!
View this answer and more for free by performing one of the following actions

Scan the QR code to install the App and get 2 free unlocks

Unlock quizzes for free by uploading documents