Exhibit 16-3
Below you are given a partial computer output based on a sample of 25 observations. 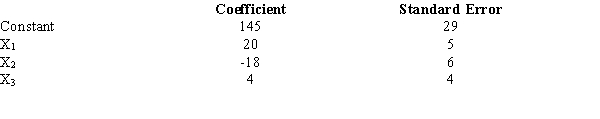
-Refer to Exhibit 16-3. The critical t value obtained from the table to test an individual parameter at the 5% level is
A) 2.06
B) 2.069
C) 2.074
D) 2.080
Correct Answer:
Verified
Q26: Exhibit 16-1
In a regression analysis involving 25
Q27: Exhibit 16-1
In a regression analysis involving 25
Q28: Exhibit 16-2
In a regression model involving 30
Q29: Exhibit 16-2
In a regression model involving 30
Q30: Exhibit 16-4
In a laboratory experiment, data were
Q32: Exhibit 16-4
In a laboratory experiment, data were
Q33: Exhibit 16-2
In a regression model involving 30
Q34: Exhibit 16-2
In a regression model involving 30
Q35: Exhibit 16-1
In a regression analysis involving 25
Q36: Exhibit 16-3
Below you are given a
Unlock this Answer For Free Now!
View this answer and more for free by performing one of the following actions

Scan the QR code to install the App and get 2 free unlocks

Unlock quizzes for free by uploading documents