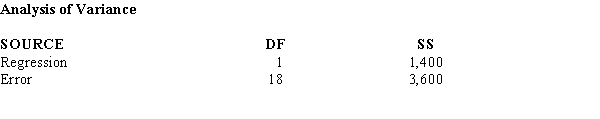
Shown below is a portion of the computer output for a regression analysis relating sales (Y in millions of dollars) and advertising expenditure (X in thousands of dollars). 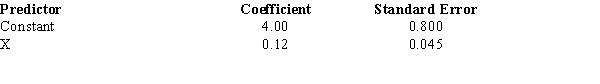
a. What has been the sample size for the above?
b. Perform a t test and determine whether or not advertising and sales are related. Let = 0.05.
c. Compute the coefficient of determination.
d. Interpret the meaning of the value of the coefficient of determination that you found in Part c. Be very specific.e. Use the estimated regression equation and predict sales for an advertising expenditure of $4,000. Give your answer in dollars.
Correct Answer:
Verified
b.t = 2.66; p-value is be...
View Answer
Unlock this answer now
Get Access to more Verified Answers free of charge
Q136: Below you are given information on
Q137: Shown below is a portion of
Q138: Part of an Excel output relating X
Q139: Below you are given a partial
Q140: Below you are given a partial
Q141: A regression and correlation analysis resulted
Q142: The following sample data contains the number
Q143: The following data shows the yearly
Q145: A company has recorded data on
Q146: The following data show the results
Unlock this Answer For Free Now!
View this answer and more for free by performing one of the following actions

Scan the QR code to install the App and get 2 free unlocks

Unlock quizzes for free by uploading documents