The following data show the results of an aptitude test (Y) and the grade point average of 10 students. 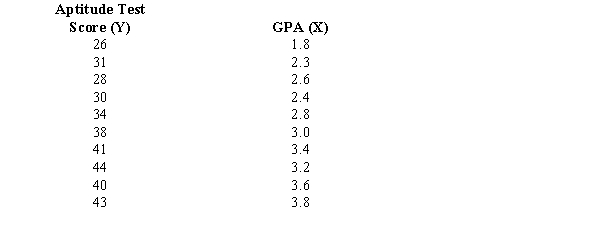
a.Develop a least squares estimated regression line.
b.Compute the coefficient of determination and comment on the strength of the regression relationship.
c.Is the slope significant? Use a t test and let = 0.05.
d.At 95% confidence, test to determine if the model is significant (i.e., perform an F test).
Correct Answer:
Verified
b.0.83; there is a...
View Answer
Unlock this answer now
Get Access to more Verified Answers free of charge
Q136: Below you are given information on
Q137: Shown below is a portion of
Q138: Part of an Excel output relating X
Q139: Below you are given a partial
Q140: Below you are given a partial
Q141: A regression and correlation analysis resulted
Q142: The following sample data contains the number
Q143: The following data shows the yearly
Q144: Shown below is a portion of
Q145: A company has recorded data on
Unlock this Answer For Free Now!
View this answer and more for free by performing one of the following actions

Scan the QR code to install the App and get 2 free unlocks

Unlock quizzes for free by uploading documents