The following table shows the results of a study on smoking and three illnesses. We are interested in determining if the proportions smokers in the three categories are different from each other.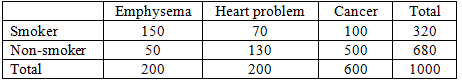
a.Provide the null and the alternative hypotheses.
b.Determine the expected frequencies.
c.Compute the sample proportions.
d.Compute the critical values (CVij).
e.Give your conclusions by providing numerical reasoning.
Correct Answer:
Verified
Ha: N...
View Answer
Unlock this answer now
Get Access to more Verified Answers free of charge
Q44: Exhibit 12-7
You want to test whether or
Q45: Shoppers were asked where they do their
Q46: Exhibit 12-7
You want to test whether or
Q47: Exhibit 12-6
The owner of a car wash
Q48: Exhibit 12-8
The following shows the number of
Q50: From a poll of 800 television viewers,
Q51: Among 1,000 managers with degrees in
Q52: Exhibit 12-8
The following shows the number of
Q53: Exhibit 12-7
You want to test whether or
Q54: Prior to the start of the season,
Unlock this Answer For Free Now!
View this answer and more for free by performing one of the following actions

Scan the QR code to install the App and get 2 free unlocks

Unlock quizzes for free by uploading documents