From a poll of 800 television viewers, the following data have been accumulated as to their levels of education and their preference of television stations. We are interested in determining if the selection of a TV station is independent of the level of education.
Educational Level 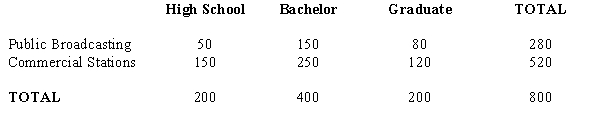
a.State the null and the alternative hypotheses.
b.Show the contingency table of the expected frequencies.
c.Compute the test statistic.
d.The null hypothesis is to be tested at 95% confidence. Determine the critical value for this test.
e.Determine the p-value and perform the test.
Correct Answer:
Verified
Q45: Shoppers were asked where they do their
Q46: Exhibit 12-7
You want to test whether or
Q47: Exhibit 12-6
The owner of a car wash
Q48: Exhibit 12-8
The following shows the number of
Q49: The following table shows the results of
Q51: Among 1,000 managers with degrees in
Q52: Exhibit 12-8
The following shows the number of
Q53: Exhibit 12-7
You want to test whether or
Q54: Prior to the start of the season,
Q55: The results of a recent study regarding
Unlock this Answer For Free Now!
View this answer and more for free by performing one of the following actions

Scan the QR code to install the App and get 2 free unlocks

Unlock quizzes for free by uploading documents