The ages of a sample of 8 faculty members selected from the School of Business Administration are shown below. 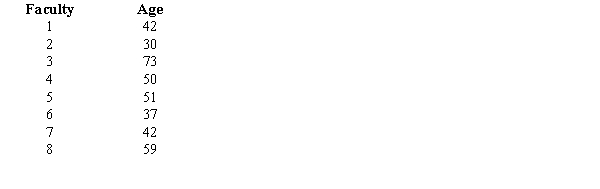
a.Compute the average age.
b.Determine the mode.
c.Compute the median age.
d.Compute the standard deviation.
Correct Answer:
Verified
b.42
...
View Answer
Unlock this answer now
Get Access to more Verified Answers free of charge
Q116: The grade point average of the students
Q132: The following data show the yearly salaries
Q133: The number of hours worked per week
Q134: The growth rates in the population of
Q135: The following is a frequency distribution for
Q136: The following frequency distribution shows the time
Q139: A local university administers a comprehensive examination
Q140: The growth rate in thepopulation of Atlanta
Q141: The following frequency distribution shows the yearly
Q142: The following data represent the daily supply
Unlock this Answer For Free Now!
View this answer and more for free by performing one of the following actions

Scan the QR code to install the App and get 2 free unlocks

Unlock quizzes for free by uploading documents