The number of hours worked per week for a sample of ten students is shown below. 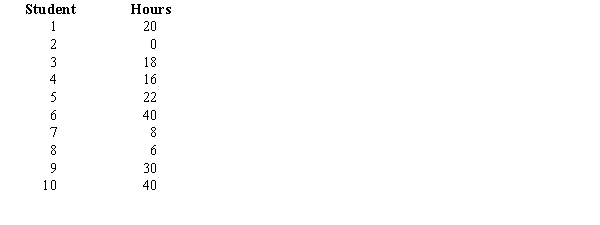
a.Determine the median and explain its meaning.
b.Compute the 70th percentile and explain its meaning.
c.What is the mode of the above data? What does it signify?
Correct Answer:
Verified
View Answer
Unlock this answer now
Get Access to more Verified Answers free of charge
Q113: In 2012, the average donation to the
Q116: The grade point average of the students
Q128: A sample of charge accounts at a
Q129: The following shows the number of job
Q131: The frequency distribution below shows the monthly
Q132: The following data show the yearly salaries
Q134: The growth rates in the population of
Q135: The following is a frequency distribution for
Q136: The following frequency distribution shows the time
Q137: The ages of a sample of 8
Unlock this Answer For Free Now!
View this answer and more for free by performing one of the following actions

Scan the QR code to install the App and get 2 free unlocks

Unlock quizzes for free by uploading documents