For the following frequency distribution, 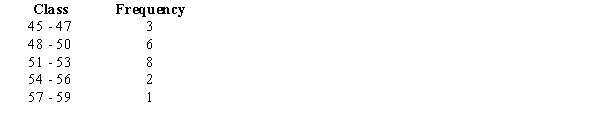
a.Compute the mean.
b.Compute the standard deviation. (Assume the data represent a population.)
Correct Answer:
Verified
Q108: The average wage of Tennessee cashiers is
Q113: In 2012, the average donation to the
Q122: The amount of time that a sample
Q123: For the following frequency distribution (assume the
Q124: The starting salaries of a sample of
Q125: The following data represent the daily demand
Q127: The following is a frequency distribution of
Q128: A sample of charge accounts at a
Q129: The following shows the number of job
Q131: The frequency distribution below shows the monthly
Unlock this Answer For Free Now!
View this answer and more for free by performing one of the following actions

Scan the QR code to install the App and get 2 free unlocks

Unlock quizzes for free by uploading documents