The following data represent the daily demand (y in thousands of units) and the unit price (x in dollars) for a product. 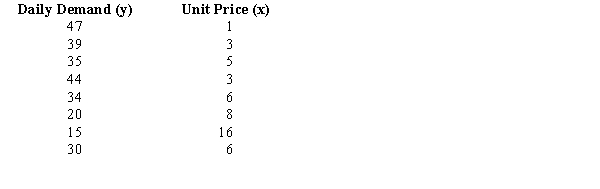
a.Compute and interpret the sample covariance for the above data.
b.Compute and interpret the sample correlation coefficient.
Correct Answer:
Verified
View Answer
Unlock this answer now
Get Access to more Verified Answers free of charge
Q108: The average wage of Tennessee cashiers is
Q113: In 2012, the average donation to the
Q120: Exhibit 3-4
The following is the frequency distribution
Q122: The amount of time that a sample
Q123: For the following frequency distribution (assume the
Q124: The starting salaries of a sample of
Q126: For the following frequency distribution, 
Q127: The following is a frequency distribution of
Q128: A sample of charge accounts at a
Q129: The following shows the number of job
Unlock this Answer For Free Now!
View this answer and more for free by performing one of the following actions

Scan the QR code to install the App and get 2 free unlocks

Unlock quizzes for free by uploading documents