The following observations are given for two variables. 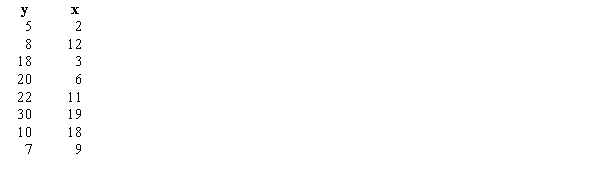
a.Compute and interpret the sample covariance for the above data.
b.Compute the standard deviation for x.
c.Compute the standard deviation for y.
d.Compute and interpret the sample correlation coefficient.
Correct Answer:
Verified
View Answer
Unlock this answer now
Get Access to more Verified Answers free of charge
Q153: The following frequency distribution shows the starting
Q154: The population change between 2000 and 2010
Q155: Compute the weighted mean for the following
Q156: In the last month, Nancy purchased gasoline
Q157: Global Engineers hired the following number of
Q159: Compute the weighted mean for the following
Q160: The variance of a sample was reported
Q161: The following frequency distribution shows the GMAT
Q162: The table below shows the population growth
Q163: Below is a sample of scores from
Unlock this Answer For Free Now!
View this answer and more for free by performing one of the following actions

Scan the QR code to install the App and get 2 free unlocks

Unlock quizzes for free by uploading documents