The table below shows the population growth rate of a city for the years 2008 through 2012. 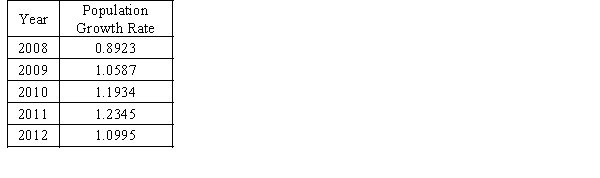
a.Compute the geometric mean.
b.What has been the percentage growth in the population of the city between 2009 to 2012?
Correct Answer:
Verified
Geomet...
View Answer
Unlock this answer now
Get Access to more Verified Answers free of charge
Q157: Global Engineers hired the following number of
Q158: The following observations are given for two
Q159: Compute the weighted mean for the following
Q160: The variance of a sample was reported
Q161: The following frequency distribution shows the GMAT
Q163: Below is a sample of scores from
Q164: The last semester grades of Nancy, a
Q165: The following data shows the number of
Q166: The following data show the yearly salaries
Q167: Aubree, a college freshman, took 15 hours
Unlock this Answer For Free Now!
View this answer and more for free by performing one of the following actions

Scan the QR code to install the App and get 2 free unlocks

Unlock quizzes for free by uploading documents