The table that follows gives the population of a city. Find the power function that best fits the data, with x equal to the number of years past 1950. According to the model, will the city's population be greater than 1,400 by the year 2010? Round your final answer to three decimal places. 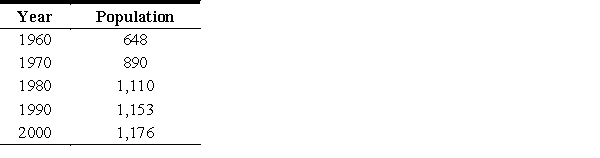
A) 
The model predicts that the population will not be greater than 1,400.
B) 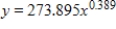
The model predicts that the population will not be greater than 1,400.
C) 
The model predicts that the population will be greater than 1,400.
D) 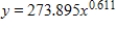
The model predicts that the population will be greater than 1,400.
E) 
The model predicts that the population will not be greater than 1,400.
Correct Answer:
Verified
Q103: Graph the power function that models the
Q104: The table shows the average earnings of
Q105: Suppose the following table gives the U.S.
Q106: The table gives the percent of the
Q107: The table below shows the national expenditures
Q108: Determine what type of function best models
Q110: Suppose the IQ scores (rounded to the
Q111: Determine whether the scatter plot should be
Q112: Determine what type of function best models
Q113: The table gives the median household income
Unlock this Answer For Free Now!
View this answer and more for free by performing one of the following actions

Scan the QR code to install the App and get 2 free unlocks

Unlock quizzes for free by uploading documents