Graph the power function that models the data given in the table below. 
A) 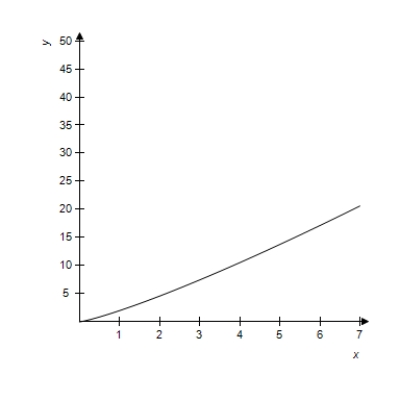
B) 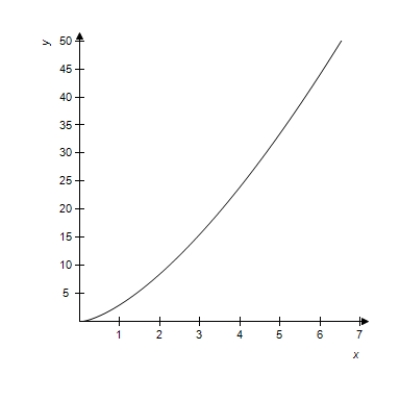
C) 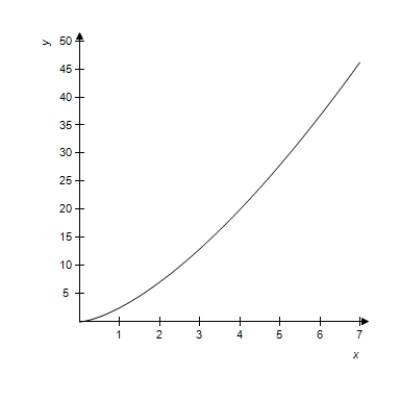
D) 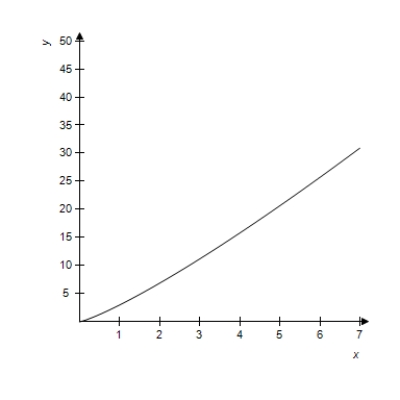
E) 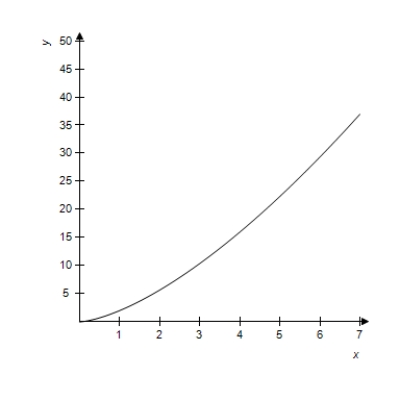
Correct Answer:
Verified
Q98: The demand function for a product is
Q99: Suppose that the cost C (in dollars)
Q100: Determine whether the given graph is the
Q101: Suppose that the following table shows the
Q102: Suppose that the following table gives the
Q104: The table shows the average earnings of
Q105: Suppose the following table gives the U.S.
Q106: The table gives the percent of the
Q107: The table below shows the national expenditures
Q108: Determine what type of function best models
Unlock this Answer For Free Now!
View this answer and more for free by performing one of the following actions

Scan the QR code to install the App and get 2 free unlocks

Unlock quizzes for free by uploading documents