Suppose that the following table shows the number of millions of people in the United States who lived below the poverty level for selected years. Find a cubic model that approximately fits the data, using x as the number of years after 1960. Round numerical values in your answer to four decimal places. Depending on the technology you use, your answer may be slightly different than the correct answer shown. 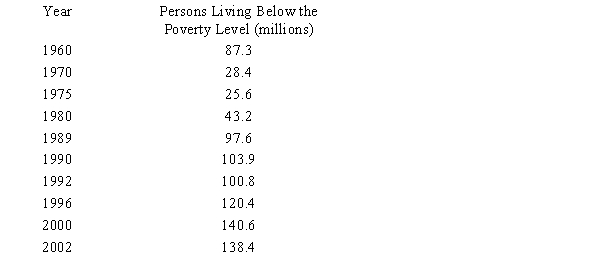
A) 
B) 
C) 
D) 
E) 
Correct Answer:
Verified
Q96: By recognizing shapes and features of polynomial
Q97: Find the rational function whose graph is
Q98: The demand function for a product is
Q99: Suppose that the cost C (in dollars)
Q100: Determine whether the given graph is the
Q102: Suppose that the following table gives the
Q103: Graph the power function that models the
Q104: The table shows the average earnings of
Q105: Suppose the following table gives the U.S.
Q106: The table gives the percent of the
Unlock this Answer For Free Now!
View this answer and more for free by performing one of the following actions

Scan the QR code to install the App and get 2 free unlocks

Unlock quizzes for free by uploading documents