Suppose that the following table gives the number of near-collisions on the runways of the nation's airports. With  representing 1990, find a quadratic function that models the data in the chart. Round numerical values in your answer to four decimal places. Depending on the technology you use, your answer may be slightly different than the correct answer shown.
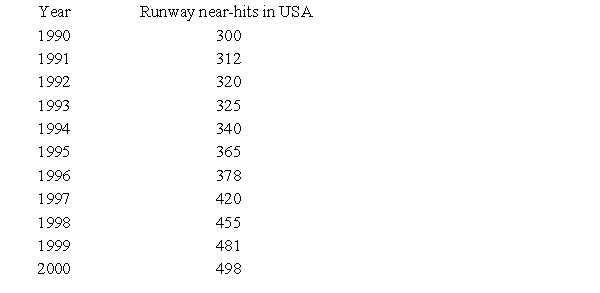
A) 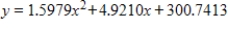
B) 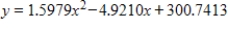
C) 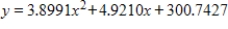
D) 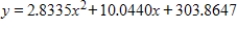
E) 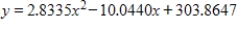
Correct Answer:
Verified
Q97: Find the rational function whose graph is
Q98: The demand function for a product is
Q99: Suppose that the cost C (in dollars)
Q100: Determine whether the given graph is the
Q101: Suppose that the following table shows the
Q103: Graph the power function that models the
Q104: The table shows the average earnings of
Q105: Suppose the following table gives the U.S.
Q106: The table gives the percent of the
Q107: The table below shows the national expenditures
Unlock this Answer For Free Now!
View this answer and more for free by performing one of the following actions

Scan the QR code to install the App and get 2 free unlocks

Unlock quizzes for free by uploading documents