The consumer price data can be modeled by the function 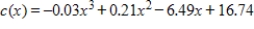 , where
  represents 1945 and
  is the consumer price index (CPI) in year
  . During what year does the model predict that the rate of change of the CPI reached its maximum?
A) 1955
B) 1981
C) 1996
D) 1977
E) 1947
Correct Answer:
Verified
Q77: Use the graph shown in the figure
Q78: The following figure shows the growth of
Q79: In this problem, Q80: A function and its first and second Q81: The following figure shows the growth of Q83: A firm has total revenue given by Q84: The graph shows a total cost function. Q85: If the total revenue function for a Q86: If the total revenue function for a Q87: Suppose that the oxygen level P (for![]()
Unlock this Answer For Free Now!
View this answer and more for free by performing one of the following actions

Scan the QR code to install the App and get 2 free unlocks

Unlock quizzes for free by uploading documents