The graph shows a total cost function. Determine the level of production at which average cost is minimized. 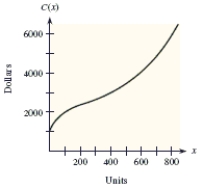
A) 200 units
B) 800 units
C) 400 units
D) 0 units
E) 600 units
Correct Answer:
Verified
Q79: In this problem, Q80: A function and its first and second Q81: The following figure shows the growth of Q82: The consumer price data can be modeled Q83: A firm has total revenue given by Q85: If the total revenue function for a Q86: If the total revenue function for a Q87: Suppose that the oxygen level P (for Q88: Suppose that the total number of units Q89: For the cost function ![]()
![]()
Unlock this Answer For Free Now!
View this answer and more for free by performing one of the following actions

Scan the QR code to install the App and get 2 free unlocks

Unlock quizzes for free by uploading documents