Which of the following figures illustrates best the sequence of the free-energy values (shown with the star) for a chemical reaction at equilibrium to the removal of products, followed by the response of the equilibrium to this stress?
A) 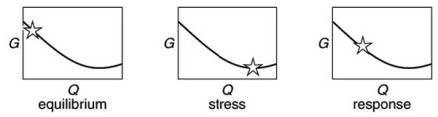
B) 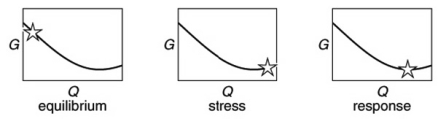
C) 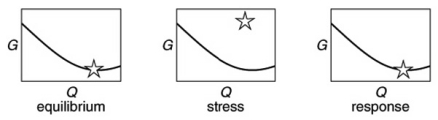
D) 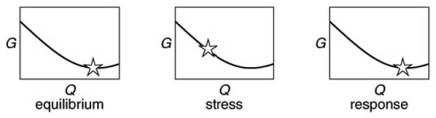
Correct Answer:
Verified
Q85: For a particular hypothetical reaction, 2A
Q86: In the equation relating equilibrium to
Q88: If for a given chemical reaction
Q89: Benzene is a liquid under standard conditions.
Q91: A sketch of the free energy for
Q92: A sketch of the free energy
Q94: Which of the following relationships are
Q95: Suppose
Q106: A perturbation or stress to a chemical
Q121: If K for a reaction is
Unlock this Answer For Free Now!
View this answer and more for free by performing one of the following actions

Scan the QR code to install the App and get 2 free unlocks

Unlock quizzes for free by uploading documents