Given the graph of the functions and . Determine the color of the graph that corresponds to . 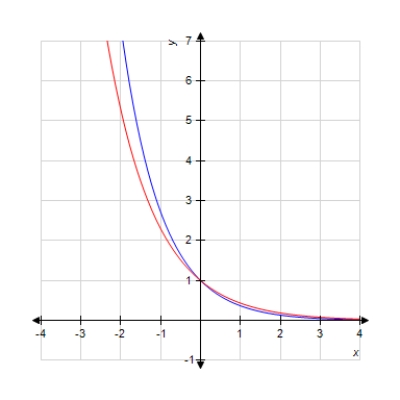
Select the correct answer.
A) Blue
B) Red
Correct Answer:
Verified
Q54: Graph the function.
Q55: Model the data using an exponential
Q56: How long, to the nearest year, will
Q57: The table below is filled correctly.
Q58: Find an equation for an exponential
Q60: The table is filled correctly.
Q61: Suppose the amount of carbon dioxide
Q62: The following chart shows the value
Q63: Find the vertex of the graph
Q64: Model the data using an exponential
Unlock this Answer For Free Now!
View this answer and more for free by performing one of the following actions

Scan the QR code to install the App and get 2 free unlocks

Unlock quizzes for free by uploading documents