The figure below shows equilibrium in an aggregate demand-aggregate supply model.The shift from AS to AS' in this figure represents a(n) :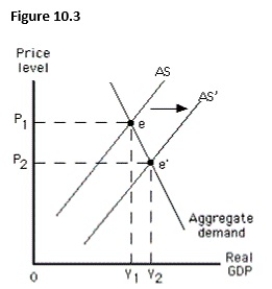
A) increase in short-run aggregate supply.
B) increase in long-run aggregate supply.
C) decrease in short-run aggregate supply.
D) decrease in long-run aggregate supply.
E) decrease in the aggregate quantity demanded.
Correct Answer:
Verified
Q72: The figure below shows short-run equilibrium in
Q73: Which of the following is true of
Q74: The figure below shows equilibrium in an
Q75: Which of these does not hold true
Q76: Which of the following if true would
Q78: The figure below shows the short-run aggregate
Q79: The amount by which actual output falls
Q80: As actual output falls below the potential
Q81: In the long run,an economy will produce
Q82: Which of the following is true when
Unlock this Answer For Free Now!
View this answer and more for free by performing one of the following actions

Scan the QR code to install the App and get 2 free unlocks

Unlock quizzes for free by uploading documents