The figure below shows equilibrium in an aggregate demand-aggregate supply model.Which of the following will be true of an economy in the long run that is at point M in the short run?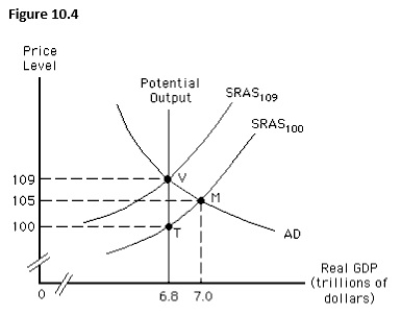
A) The actual price level will be lower than the expected price level.
B) The actual output will fall short of the potential output.
C) The short-run aggregate supply curve will remain stable at SRAS100.
D) The short-run aggregate supply curve will shift to SRAS109.
E) Real GDP will be equal to nominal GDP.
Correct Answer:
Verified
Q69: The figure below shows the equilibrium in
Q70: The figure below shows equilibrium in an
Q71: The figure below shows equilibrium in an
Q72: The figure below shows short-run equilibrium in
Q73: Which of the following is true of
Q75: Which of these does not hold true
Q76: Which of the following if true would
Q77: The figure below shows equilibrium in an
Q78: The figure below shows the short-run aggregate
Q79: The amount by which actual output falls
Unlock this Answer For Free Now!
View this answer and more for free by performing one of the following actions

Scan the QR code to install the App and get 2 free unlocks

Unlock quizzes for free by uploading documents