The figure below shows the equilibrium in an aggregate demand-aggregate supply model.In this figure,which of the following is true for an economy that is at point V in the short run?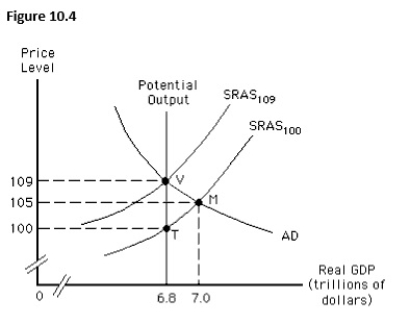
A) There is a recessionary gap worth $200 billion.
B) The potential output is $7 trillion.
C) The actual price level is 100.
D) The natural rate of unemployment is more than 6.8 trillion.
E) The actual output is equal to the potential output.
Correct Answer:
Verified
Q64: Which of the following occurs when an
Q65: The figure below shows equilibrium in an
Q66: If resource suppliers and demanders find out
Q67: If the expected price level exceeds the
Q68: The figure below shows the short-run aggregate
Q70: The figure below shows equilibrium in an
Q71: The figure below shows equilibrium in an
Q72: The figure below shows short-run equilibrium in
Q73: Which of the following is true of
Q74: The figure below shows equilibrium in an
Unlock this Answer For Free Now!
View this answer and more for free by performing one of the following actions

Scan the QR code to install the App and get 2 free unlocks

Unlock quizzes for free by uploading documents