The following graph shows the supply of and demand for baseballs in the United States.If the world price is $3 per baseball and a tariff of $1 per baseball is imposed,then the tariff revenue collected by the United States government is _____.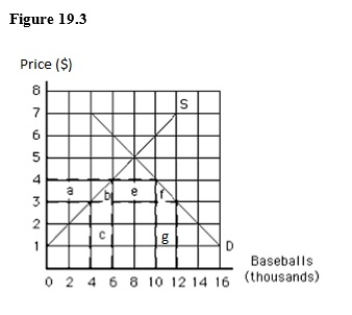
A) $4,000
B) $16,000
C) $20,000
D) $24,000
E) $48,000
Correct Answer:
Verified
Q58: The following graph shows the market equilibrium
Q59: The world demand for and the world
Q60: The following graph shows the market equilibrium
Q61: An effective import quota:
A)lowers the price of
Q62: The following graph shows the demand for
Q64: Suppose the government of an importing country
Q65: The following image shows the market for
Q66: The following graph shows the demand for
Q67: The following image shows the market for
Q68: The following graph shows the supply of
Unlock this Answer For Free Now!
View this answer and more for free by performing one of the following actions

Scan the QR code to install the App and get 2 free unlocks

Unlock quizzes for free by uploading documents