The following graph shows the demand for and the supply of a good in a country.If the world price of the good is $2.00 per unit and an import quota of 50 units per month is imposed,then the decrease in consumer surplus can be represented by the area _____.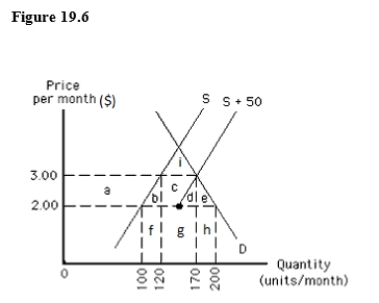
A) f
B) i
C) h
D) f,g,and h
E) a,b,c,d,and e
Correct Answer:
Verified
Q57: A charge levied on imports in terms
Q58: The following graph shows the market equilibrium
Q59: The world demand for and the world
Q60: The following graph shows the market equilibrium
Q61: An effective import quota:
A)lowers the price of
Q63: The following graph shows the supply of
Q64: Suppose the government of an importing country
Q65: The following image shows the market for
Q66: The following graph shows the demand for
Q67: The following image shows the market for
Unlock this Answer For Free Now!
View this answer and more for free by performing one of the following actions

Scan the QR code to install the App and get 2 free unlocks

Unlock quizzes for free by uploading documents