A statistics course at a large university is taught in each semester. A student has noticed that the students in semester 1 and semester 2 are enrolled in different degrees. To investigate, the student takes a random sample of 25 students from semester 1 and 25 students from semester 2 and records their final marks (%) provided in the table below. Excel was used to generate descriptive statistics on each sample.
Assume that student final marks are normally distributed in each semester. 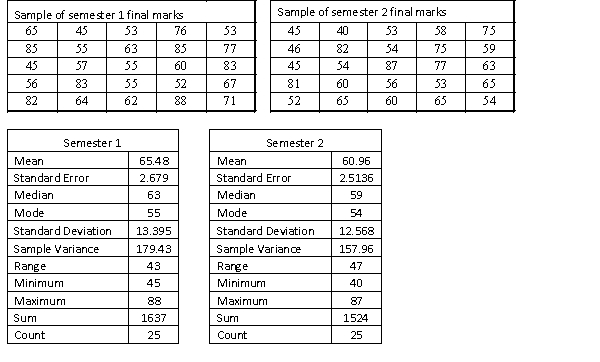 Estimate and interpret a 90% confidence interval of the ratio of population variances of final student marks from semester 1 and semester 2.
Correct Answer:
Verified
View Answer
Unlock this answer now
Get Access to more Verified Answers free of charge
Q75: A statistics course at a large university
Q76: A statistics course at a large university
Q77: The sampling distribution of the random variable
Q78: With hypothesis testing, there are only two
Q79: The irradiation of food to destroy
Q81: Videocassette recorder (VCR) tapes are designed
Q82: Videocassette recorder (VCR) tapes are designed
Q83: There are different approaches to fitness
Q84: There are different approaches to fitness
Q85: Videocassette recorder (VCR) tapes are designed
Unlock this Answer For Free Now!
View this answer and more for free by performing one of the following actions

Scan the QR code to install the App and get 2 free unlocks

Unlock quizzes for free by uploading documents