Pop-up coffee vendors have been popular in the city of Adelaide in 2013. A vendor is interested in knowing how temperature (in degrees Celsius) and number of different pastries and biscuits offered to customers impacts daily hot coffee sales revenue (in $00's).
A random sample of 6 days was taken, with the daily hot coffee sales revenue and the corresponding temperature and number of different pastries and biscuits offered on that day, noted.
Describe the following scatterplots. 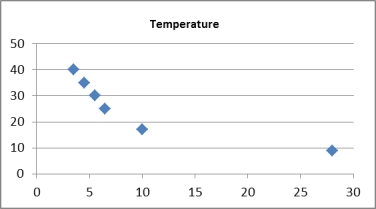 Scatterplot of Daily hot coffee sales revenue vs Temperature
 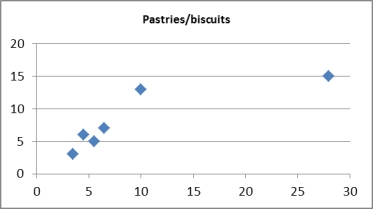 Scatterplot of Daily hot coffee sales revenue Pastries/biscuits
 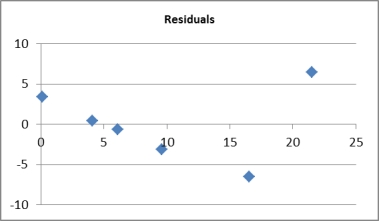 Residual scatterplot of Daily hot coffee sales revenue vs fitted values
Correct Answer:
Verified
View Answer
Unlock this answer now
Get Access to more Verified Answers free of charge
Q111: A statistician wanted to determine whether
Q112: A statistician wanted to determine whether
Q113: Pop-up coffee vendors have been popular
Q114: An economist wanted to develop a
Q115: An economist wanted to develop a
Q116: Pop-up coffee vendors have been popular
Q117: A statistician wanted to determine whether
Q118: An economist wanted to develop a
Q119: Pop-up coffee vendors have been popular
Q120: A statistics professor investigated some of
Unlock this Answer For Free Now!
View this answer and more for free by performing one of the following actions

Scan the QR code to install the App and get 2 free unlocks

Unlock quizzes for free by uploading documents