Figure 13-4.On the horizontal axis of the graph,L represents the quantity of loanable funds in billions of dollars. 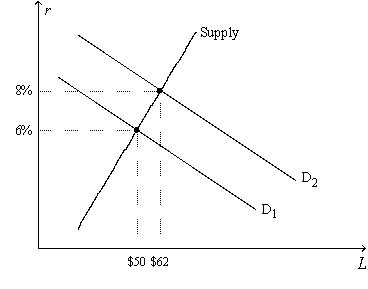
-Refer to Figure 13-4.Which of the following events could explain a shift of the demand-for-loanable-funds curve from  to
to  ?
?
A) The tax code is reformed to encourage greater saving.
B) The tax code is reformed to encourage greater investment.
C) The government starts running a budget deficit.
D) The government starts running a budget surplus.
Correct Answer:
Verified
Q120: For an imaginary economy,when the real interest
Q121: For an imaginary economy,when the real interest
Q136: For an imaginary economy,when the real interest
Q364: Figure 13-3. The figure shows two demand-for-loanable-funds
Q366: Figure 13-2. The figure depicts a supply-of-loanable-funds
Q368: Figure 13-3. The figure shows two demand-for-loanable-funds
Q372: Figure 13-3. The figure shows two demand-for-loanable-funds
Q375: Figure 13-1. The figure depicts a demand-for-loanable-funds
Q395: Figure 13-4. On the horizontal axis of
Q398: Figure 13-4. On the horizontal axis of
Unlock this Answer For Free Now!
View this answer and more for free by performing one of the following actions

Scan the QR code to install the App and get 2 free unlocks

Unlock quizzes for free by uploading documents