The following diagram is a cost-volume-profit graph for a manufacturing company: 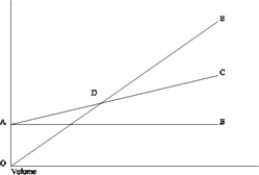 The difference between line AB and line AC (area BAC) is the
A) contribution ratio.
B) total variable cost.
C) contribution margin per unit.
D) total fixed cost.
Correct Answer:
Verified
Q22: Which of the following assumptions does NOT
Q24: In a cost-volume-profit graph,
A) the total revenue
Q27: In a cost-volume-profit graph, the slope of
Q78: In 2018, Samantha's Bath and Body Shop
Q79: Jamie Quinn, a sole proprietor, has
Q80: Assume the following cost behavior data
Q81: In a cost-volume-profit graph, the total revenue
Q82: Which of the following is true of
Q86: Which of the following is true of
Q87: The following diagram is a cost-volume-profit graph
Unlock this Answer For Free Now!
View this answer and more for free by performing one of the following actions

Scan the QR code to install the App and get 2 free unlocks

Unlock quizzes for free by uploading documents