The following diagram is a cost-volume-profit graph for a manufacturing company: 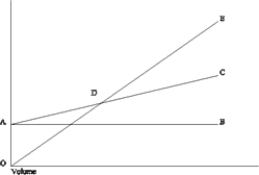
The formula to determine the Y-axis value ($) at point D on the graph is
A) Fixed costs + (Variable costs per unit × Number of units) .
B) ΣXY − bΣX.
C) Fixed costs/Unit contribution margin.
D) Fixed costs/Contribution margin ratio.
Correct Answer:
Verified
Q12: On a profit-volume graph, the profit line
Q18: Product 1 has a contribution margin of
Q22: Which of the following assumptions does NOT
Q24: In a cost-volume-profit graph,
A) the total revenue
Q27: In a cost-volume-profit graph, the slope of
Q82: Which of the following is true of
Q83: The following diagram is a cost-volume-profit graph
Q86: Which of the following is true of
Q89: The following data pertain to the
Q92: Assuming all other things are the same,
Unlock this Answer For Free Now!
View this answer and more for free by performing one of the following actions

Scan the QR code to install the App and get 2 free unlocks

Unlock quizzes for free by uploading documents