Exhibit 7-14 Cost curves 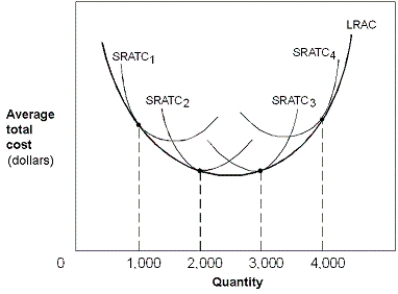
-In Exhibit 7-14, the U-shaped LRAC curve indicates which of the following as quantity increases from 0 to 4,000?
A) Diseconomies of scale; constant returns to scale; economies of scale.
B) Constant returns to scale; economies of scale; diseconomies of scale.
C) Economies of scale; constant returns to scale; diseconomies of scale.
D) Diseconomies of scale; economies of scale; constant returns to scale.
E) Economies of scale; diseconomies of scale; constant returns to scale.
Correct Answer:
Verified
Q16: What is the difference between economic and
Q213: Exhibit 7-16 Long-run average cost curves
Q214: Exhibit 7-15 Long-run average cost 
Q215: Suppose Joe Rich owns his own company
Q216: In the short-run, total fixed costs always
Q217: Exhibit 7-15 Long-run average cost
Q219: Exhibit 7-15 Long-run average cost
Q220: If economic profit is zero, then a
Q221: The law of diminishing returns causes a
Q222: Diseconomies of scale occur when high levels
Unlock this Answer For Free Now!
View this answer and more for free by performing one of the following actions

Scan the QR code to install the App and get 2 free unlocks

Unlock quizzes for free by uploading documents