Exhibit 7-15 Long-run average cost 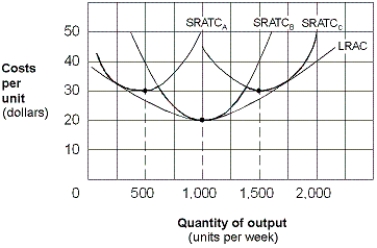
-In Exhibit 7-15, diseconomies of scale are shown in the range of:
A) 0 to 500 units per week.
B) 500 to 1,000 units per week.
C) 1,000 to 2,000 units per week.
D) zero per week.
Correct Answer:
Verified
Q209: Exhibit 7-17 Long-run average cost curve
Q210: Exhibit 7-17 Long-run average cost curve
Q211: Exhibit 7-17 Long-run average cost curve
Q212: If marginal product is at a maximum,
Q213: Exhibit 7-16 Long-run average cost curves
Q215: Suppose Joe Rich owns his own company
Q216: In the short-run, total fixed costs always
Q217: Exhibit 7-15 Long-run average cost 
Q218: Exhibit 7-14 Cost curves Q219: Exhibit 7-15 Long-run average cost ![]()
Unlock this Answer For Free Now!
View this answer and more for free by performing one of the following actions

Scan the QR code to install the App and get 2 free unlocks

Unlock quizzes for free by uploading documents