Exhibit 4-8 Demand and supply curves
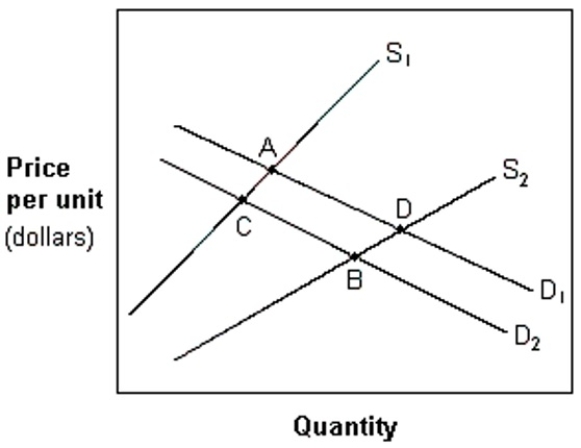
-In Exhibit 4-8, a movement from A to B is best explained by:
A) an increase in income and in the number of suppliers.
B) an increase in the price of other goods.
C) an increase in the population.
D) a decrease in income and an improvement in the technology used to produce the good.
E) equilibrium quantity increases and the equilibrium price change is indeterminate.
Correct Answer:
Verified
Q47: Rent control applies to about two-thirds of
Q74: Ceteris paribus, an increase in the supply
Q75: An increase in demand and a decrease
Q76: If market supply decreases and, simultaneously, market
Q77: A price ceiling that sets the price
Q78: Exhibit 4-8 Demand and supply curves
Q80: Exhibit 4-7 Demand and supply schedules
Q81: An example of a price ceiling would
Q82: Suppose a price ceiling is set by
Q83: If the equilibrium price of bread is
Unlock this Answer For Free Now!
View this answer and more for free by performing one of the following actions

Scan the QR code to install the App and get 2 free unlocks

Unlock quizzes for free by uploading documents