Exhibit 4-8 Demand and supply curves
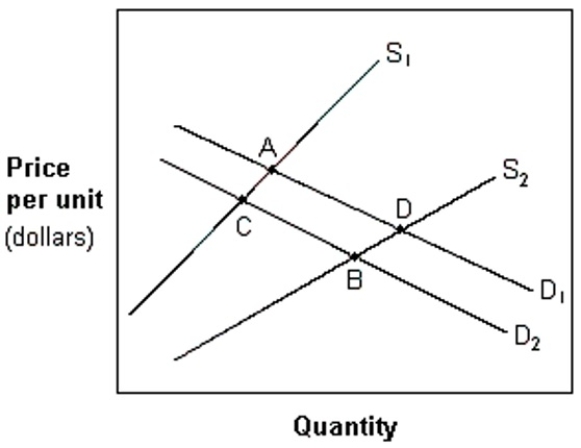
-In Exhibit 4-8, a movement from A to B in which price has decreased and quantity has increased is best explained by a(n) :
A) increase in supply and demand.
B) decrease in supply and demand.
C) increase in supply that dominates a decrease in demand.
D) increase in demand that dominates a decrease supply.
E) decrease in demand that dominates an increase in supply.
Correct Answer:
Verified
Q57: Exhibit 4-3 Supply and demand curves
Q58: Exhibit 4-4 Supply and demand curves for
Q59: Exhibit 4-3 Supply and demand curves
Q60: Exhibit 4-4 Supply and demand curves for
Q61: If consumers switch away from eating margarine
Q63: Exhibit 4-8 Demand and supply curves
Q64: An increase in both supply and demand
Q65: Exhibit 4-6 Demand and supply curves
Q66: Exhibit 4-7 Demand and supply schedules
Q67: An increase in consumers' incomes will have
Unlock this Answer For Free Now!
View this answer and more for free by performing one of the following actions

Scan the QR code to install the App and get 2 free unlocks

Unlock quizzes for free by uploading documents