Assume that that the two graphs below are identical demand curves for hamburger. The only difference is that the one on the left measures hamburger in pounds and the one on the right measures hamburger in ounces. The elasticity of demand between the prices of $3 and $2 should be the same in both cases. However, prove that calculating the slopes between these two points on each graph would not be helpful in determining elasticity of demand. 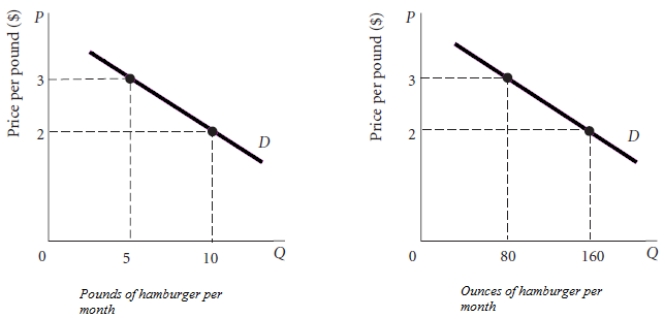
Correct Answer:
Verified
View Answer
Unlock this answer now
Get Access to more Verified Answers free of charge
Q7: What does elasticity measure?
Q8: In the past dating was a fairly
Q9: What does it mean for a good
Q10: Assume a customer of natural gas is
Q11: Why is the price elasticity of demand
Q13: What does it mean for a good
Q14: The price elasticity of demand for gasoline
Q15: Why isn't slope as useful as elasticity
Q16: Define price elasticity of demand. What does
Q17: Refer to the information provided in Scenario
Unlock this Answer For Free Now!
View this answer and more for free by performing one of the following actions

Scan the QR code to install the App and get 2 free unlocks

Unlock quizzes for free by uploading documents